


7-2
Programmer’s Guide
Using Graphics
Introduction
Introduction
The analyzer has a set of user graphics commands that can be used to
create graphics and messages on the display. The
GRAPHICS
example
program in the Example Programs Guide uses some of these commands
to draw a simple setup diagram. These commands, listed below, are of
the form:
DISPlay:WINDow[1|2|10]:GRAPhics:<mnemonic>.
The number specified in the
WINDow
part of the command selects where
the graphics are to be written.
WINDow1
draws the graphics to the channel 1 measurement
screen. (This is the default if no window is specified in
the mnemonic.)
WINDow2
draws the graphics to the channel 2 measurement
screen.
WINDow10
draws the graphics to an IBASIC display partition. The
graphics can only be output in red on a PCL printer.
NOTE
When graphics commands are used to write directly to a measurement
screen, they write to the static graphics plane (the same plane where the
graticule is drawn). There is no sweep-to-sweep speed penalty once the
graphics have been drawn.
Summary of Contents for 8712ES
Page 11: ...1 1 1 Introduction to GPIB Programming ...
Page 27: ...2 1 2 Synchronizing the Analyzer and a Controller ...
Page 36: ...3 1 3 Passing Control ...
Page 39: ...4 1 4 Data Types and Encoding ...
Page 46: ...5 1 5 Using Status Registers ...
Page 71: ...6 1 6 Trace Data Transfers ...
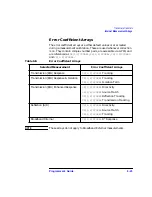
Page 98: ...6 28 Programmer sGuide Trace Data Transfers Internal Measurement Arrays ...
Page 99: ...7 1 7 Using Graphics ...
Page 105: ...8 1 8 Front Panel Keycodes ...
Page 111: ...9 1 9 Introduction to SCPI ...
Page 129: ...10 1 10 Menu Map with SCPI Commands ...
Page 268: ...12 1 12 SCPI Conformance Information ...
Page 290: ...13 1 13 SCPI Error Messages ...


