


351
Logic Analyzer Reference
The Chart Menu
The Chart Menu
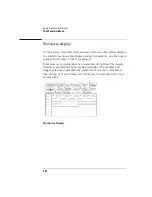
State Chart is a software post-processing feature that provides the
ability to build x-y charts of label activity using state data. The Chart
menu builds a graphical representation of the system under test. The Y
axis always represents data values for a specified label. You can select
whether the X axis represents states (rows in the state listing) or the
data values for another label.
When the X-axis is set to State, X and O markers are available which
display the current sample relative to the trace point and the
corresponding Y-axis data value. Marker placement is synchronized
with the normal state listing.
An accumulate mode is available that allows the chart display to build
up over several runs.
You can generate x-y charts of Label vs. Label or Label vs. State.
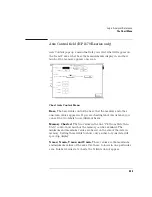
Label vs. Label charts
When labels are assigned to both axes, the chart shows how the data
acquired under one label varies relative to the other for a particular
measurement. Label values are always plotted in ascending order from
the bottom to the top of the chart and in ascending order from left to
right across the chart. Plotting a label against itself will result in a
diagonal line from the lower left to upper right corner. All markers are
disabled when plotting this kind of chart.
Label vs. State charts
Label versus State is a plot of data values acquired under a label versus
the memory location of the same data. The label value is plotted
against successive memory location numbers.
Summary of Contents for 1670E Series
Page 6: ...6 In This Book...
Page 26: ...26 Contents...
Page 27: ...27 Section 1 Logic Analyzer...
Page 28: ...28...
Page 29: ...29 1 Logic Analyzer Overview...
Page 39: ...39 2 Connecting Peripherals...
Page 49: ...49 3 Using the Logic Analyzer...
Page 72: ...72 Using the Logic Analyzer The Inverse Assembler...
Page 73: ...73 4 Using the Trigger Menu...
Page 101: ...101 5 Using the Oscilloscope...
Page 151: ...151 6 Using the Pattern Generator...
Page 199: ...199 7 Triggering Examples...
Page 237: ...237 8 File Management...
Page 249: ...249 9 Logic Analyzer Reference...
Page 360: ...360 Logic Analyzer Reference The Compare Menu...
Page 361: ...361 10 System Performance Analysis SPA Software...
Page 397: ...397 11 Logic Analyzer Concepts...
Page 430: ...430 Logic Analyzer Concepts The Analyzer Hardware Oscilloscope board theory Oscilloscope board...
Page 439: ...439 12 Troubleshooting the Logic Analyzer...
Page 455: ...455 13 Specifications...
Page 471: ...471 14 Operator s Service...
Page 479: ...479 Operator s Service Troubleshooting Troubleshooting Flowchart 2...
Page 491: ...491 Section 2 LAN...
Page 492: ...492...
Page 493: ...493 15 Introducing the LAN Interface...
Page 497: ...497 16 Connecting and Configuring the LAN...
Page 506: ...506 Connecting and Configuring the LAN Connecting and Configuring the LAN...
Page 507: ...507 17 Accessing the Logic Analyzer File System Using the LAN...
Page 515: ...515 18 Using the LAN s X Window Interface...
Page 527: ...527 19 Retrieving and Restoring Data Using the LAN...
Page 539: ...539 20 Programming the Logic Analyzer Using the LAN...
Page 546: ...546 Programming the Logic Analyzer Using the LAN Programming the Logic Analyzer Using the LAN...
Page 547: ...547 21 LAN Concepts...
Page 555: ...555 22 Troubleshooting the LAN Connection...
Page 580: ...580 Troubleshooting the LAN Connection Getting Service Support...
Page 581: ...581 Section 3 Symbol Utility...
Page 582: ...582...
Page 583: ...583 23 Symbol Utility Introduction...
Page 588: ...588 Symbol Utility Introduction Symbol Utility Introduction...
Page 589: ...589 24 Getting Started with the Symbol Utility...
Page 597: ...597 25 Using the Symbol Utility...
Page 609: ...609 26 Symbol Utility Features and Functions...


