A
DMINISTRATOR
S
ECTION
C
HAPTER
4: A
NALYZE
D
ATA
IN
C
ONSOLE
8
E
6 T
ECHNOLOGIES
, A
PPLIANCE
W
ATCHDOG
A
DMINISTRATOR
U
SER
G
UIDE
35
Chapter 4: Analyze Data in Console
This chapter explains how to use the Status, History, and
Log screens to analyze data that displays in the Adminis-
trator console. Once you have reviewed this criteria, you will
be able to better monitor the health of the 8e6 appliances on
your network and collectively manage these units.
Status screen
The Status screen is accessible by clicking the
Status
menu
item in the Administrator console:
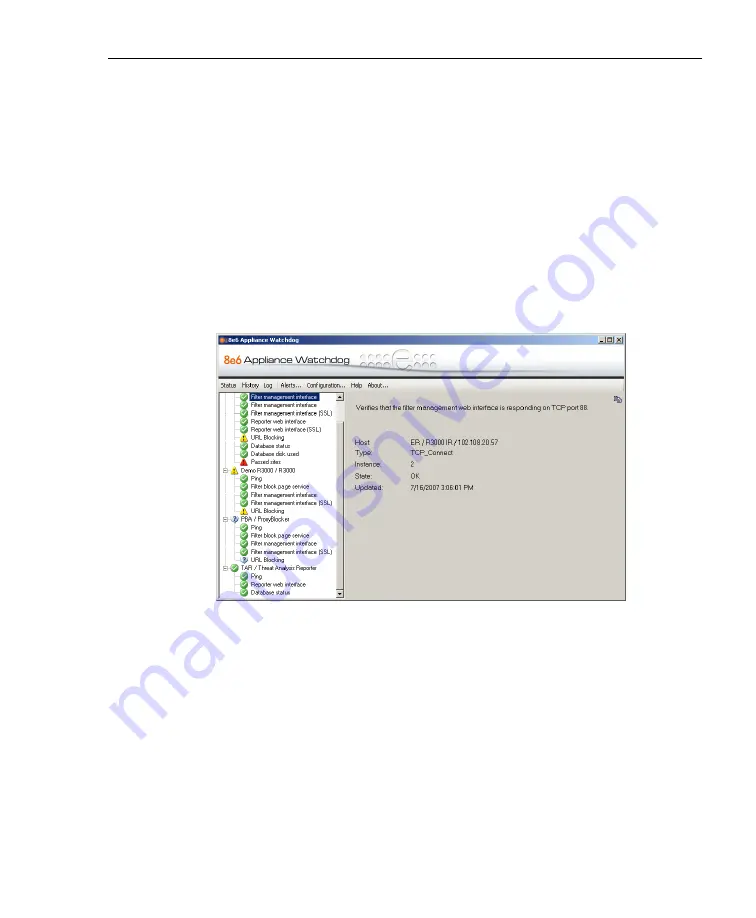
Fig. 1:4-1 Status screen
This screen includes a tree of appliances in the left panel,
with a list of testpoint states for each appliance. Each item in
the tree is preceded by an icon showing its current state: OK
(green circle with white checkmark), Unknown (white
balloon with question mark), Warning (yellow triangle with
exclaimation point), Failed (red triangle with exclaimation
point).
Click an item in the tree to display details about its status in
the right panel.


