Hitachi MK-96RD617-08, User Manual
The Hitachi MK-96RD617-08 User Manual is available for download, absolutely free! This comprehensive manual provides step-by-step instructions on how to operate and make the most of your Hitachi MK-96RD617-08. Get your free copy now at manualshive.com and unlock the full potential of this remarkable product.
Share
Download


Reviews:
No comments
Related manuals for MK-96RD617-08
VMS
Brand: QMS Pages: 118
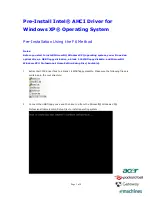
AO533
Brand: Acer Pages: 4
PSB
Brand: F-SECURE Pages: 43
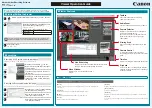
VB-M40
Brand: Canon Pages: 2
PowerShot SX1 IS
Brand: Canon Pages: 48
70 MC - ZR70MC MiniDV Digital Camcorder
Brand: Canon Pages: 57
Optura Pi
Brand: Canon Pages: 90
Optura Pi
Brand: Canon Pages: 2
PSB
Brand: F-SECURE Pages: 18
CR-1 Mark II
Brand: Canon Pages: 8

3211B001 - PowerShot E1 Digital Camera
Brand: Canon Pages: 50
3508B001 - PowerShot D10 Digital Camera
Brand: Canon Pages: 47
3508B001 - PowerShot D10 Digital Camera
Brand: Canon Pages: 64
3211B001 - PowerShot E1 Digital Camera
Brand: Canon Pages: 83
EOS 60D
Brand: Canon Pages: 5

EOS-1D Mark II Digial
Brand: Canon Pages: 2
PowerShot A410
Brand: Canon Pages: 106
PowerShot A420
Brand: Canon Pages: 132


